How Much Passive Income Can a Drink Vending Machine Make Monthly?
A drink vending machine typically earns between $150 and $600 in net profit per month, but the real range can be much wider, depending on where you place it and how you manage it. A machine sitting in a quiet hallway might pull in $75. The same machine in a busy office building or school cafeteria? Easily $800 or more.
If you’re thinking about starting a beverage vending machine business or you already own one and want to know if you’re leaving money on the table, this guide breaks it all down. Real numbers. Actual costs. No fluff.
A well-placed drink vending machine generates $300–$800 in monthly gross revenue. After subtracting product costs, location commission, and operating expenses, most operators net $150–$400 per machine, per month. High-traffic locations like airports, hospitals, and large office buildings can push that to $600–$1,000+ net monthly.
How Much Does a Drink Vending Machine Actually Make?
The question sounds simple. The answer has layers.
The U.S. vending industry generates roughly $7.7 billion in annual revenue across approximately two million active machines. That’s an average of about $3,850 per machine per year, or around $320/month. But averages mask the real story.
Location Type | Avg. Gross Revenue / Month | Est. Net Profit / Month |
Low traffic (rural area, quiet hallway) | $75–$150 | $30–$70 |
Average location (small office, clinic) | $200–$400 | $80–$180 |
Good location (mid-size office, gym) | $400–$700 | $180–$350 |
High traffic (school, hospital, large office) | $700–$1,200 | $350–$600 |
Prime location (airport, transit hub) | $1,200–$2,500+ | $600–$1,200+ |
These figures are consistent with data from multiple industry sources, including IBISWorld’s 2025 vending industry report. Soda vending machines specifically average around $400/month in net profit when placed in schools or similar captive-audience environments.
Drink Machines vs. Snack Machines: Which Earns More?
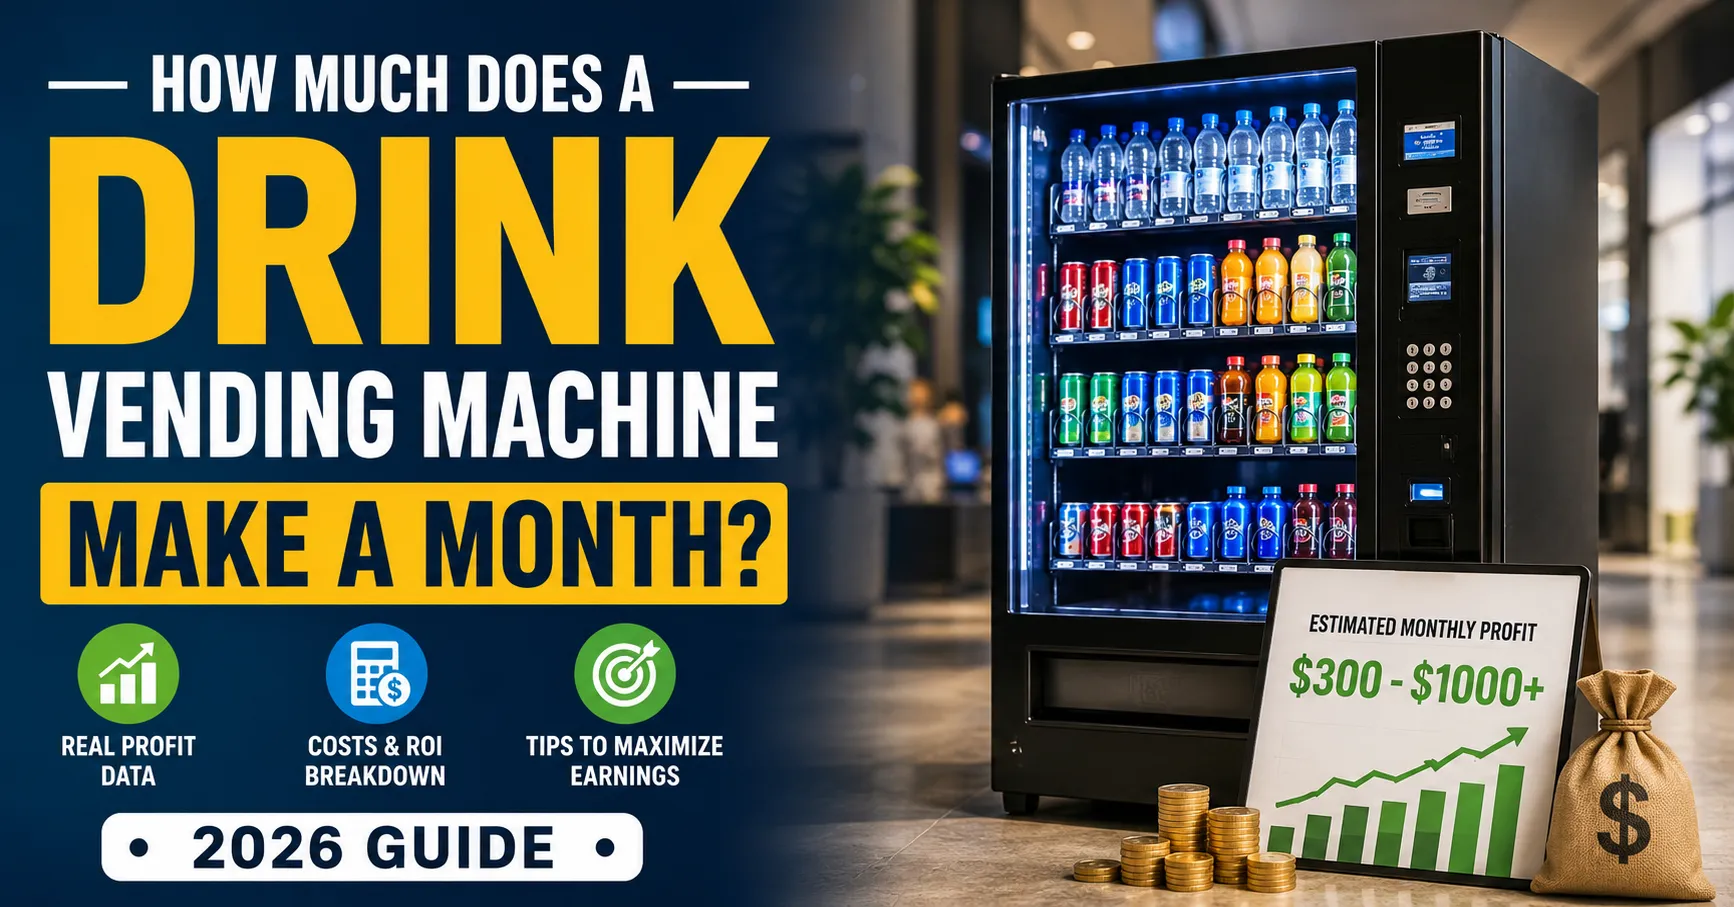
Pure beverage machines, stocked with Coca-Cola, Pepsi, bottled water, energy drinks, and juices, often outperform snack-only machines in certain locations because:
- Drinks are a daily purchase habit, not an impulse buy
- Beverages carry strong brand loyalty (people seek out their preferred drink)
- Markup on bottled water can reach 500–600% at wholesale prices
- Drink machines experience fewer product jams and mechanical issues
That said, combo snack-and-drink machines typically average $600/month in net profit and often beat standalone drink machines simply because they capture more purchase occasions per customer visit.
What Actually Drives Beverage Vending Machine Revenue
Four variables control almost everything. Get these right, and you’re profitable. Get them wrong, and the machine becomes an expensive burden.
1. Location and Foot Traffic
This is the single biggest lever. A drink machine needs a captive audience, people who can’t easily walk to a convenience store or break room refrigerator. The sweet spot is a place where 50+ people pass by daily and have limited alternatives.
Think about it from the buyer’s perspective: if they’re thirsty in the middle of a 10-hour factory shift, they’re buying from the nearest machine. That’s the environment that drives consistent monthly vending machine sales.
2. Product Selection and Pricing
Stock what your audience actually drinks. An office of health-conscious professionals wants sparkling water and kombucha. A high school cafeteria sells Mountain Dew and Gatorade. Misaligning products with your audience is one of the most common and most expensive mistakes new operators make.
On pricing: mark up products at least 100–150% over your wholesale cost. A bottle of water you buy for $0.30 wholesale should sell for $1.25–$1.50. Soda cans purchased for $0.35 each realistically vend at $1.25–$1.75, depending on location.
3. Machine Condition and Technology
Broken machines make zero money. A drink machine that’s out of order for even three days a month loses roughly 10% of its monthly earning potential. Modern smart vending machines with cashless payment systems, remote inventory tracking, and digital screens consistently outperform older cash-only units.
According to industry data, adding cashless payment options increases vending machine sales by up to 30–50%. Most customers today don’t carry cash, especially younger demographics that make up a large share of beverage buyers.
4. Restocking Frequency
A sold-out machine earns nothing. If your drink machine runs out of Coca-Cola on a Thursday afternoon, you’re losing sales until your next restock visit. The best operators use smart telemetry or simple sales tracking to restock on a data-driven schedule rather than guessing.
The Full Operating Cost Breakdown
This is where most beginners underestimate their business. Gross revenue is exciting. Net profit is what actually matters. Here’s every cost you need to account for:
Cost Category | Typical Monthly Amount | Notes |
Product inventory (COGS) | $100–$300 | Roughly 50% of gross revenue is a common rule of thumb |
Location commission | $30–$150 | Usually, 5–20% of gross sales are paid to the property owner |
Electricity | $20–$50 | Refrigerated drink machines typically cost more to operate |
Credit card processing | $10–$30 | Most cashless systems charge around 2–4% per transaction |
Transportation/fuel | $20–$60 | Includes travel costs for restocking and servicing |
Maintenance & repairs | $15–$40 | Based on approximately $300–$500 in annual maintenance |
Insurance | $25–$50 | General liability coverage is often required |
Machine loan payment | $0–$160 | Only applies if the vending machine is financed |
Total Estimated Monthly Costs | $220–$840 | Actual costs vary depending on machine volume and location quality |
Location commission is negotiable and varies widely. Low-traffic locations may accept a flat fee of $50/month. High-traffic, desirable spots like hospitals or office buildings may demand 15–20% of gross revenue. Always negotiate commission BEFORE signing a placement agreement; it’s the most impactful ongoing cost variable you control.
Net Profit Calculation: A Real-World Example
Let’s run the actual math on a drink vending machine placed in a medium-sized office building with 200 employees.
Item | Monthly Figure |
Gross revenue (15 drinks/day × $1.50 × 26 workdays) | $585 |
Product cost (approximately 50% of gross revenue) | – $293 |
Location commission (10% of gross sales) | – $59 |
Electricity | – $35 |
Credit card processing fees (3%) | – $18 |
Transportation/fuel | – $30 |
Maintenance & repairs (amortized) | – $25 |
Estimated Net Monthly Profit | $125 |
That $125/month looks modest, but remember, this is one machine that requires only a few hours of attention per month. Add a second machine in the same building, and your net doubles while your transportation cost stays the same. That’s the core economics of building a vending machine route.
Place that same machine in a hospital lobby where foot traffic is 10x higher, and the numbers shift dramatically:
Item | Hospital Location |
Gross revenue (60 drinks/day × $1.75 × 30 days) | $3,150 |
Product cost (approximately 50% of gross revenue) | – $1,575 |
Location commission (15% of gross sales) | – $473 |
Electricity + other operating costs | – $160 |
Estimated Net Monthly Profit | $942 |
Same machine. Different location. Six times the profit.
Best Locations for Drink Vending Machine Profit
Choosing where to place your machine is the most consequential decision you’ll make. Here are the locations that consistently deliver the highest vending machine earnings:
Tier 1: Highest Revenue Locations
- Hospitals and medical centers, 24/7 foot traffic, captive audience, premium pricing accepted
- Large office buildings (100+ employees), daily buyers, predictable traffic
- Manufacturing plants and warehouses, long shifts, limited options, high volume
- At airports and transit hubs, travelers are willing to pay premium prices
- Universities and colleges, high-density young consumers, and constant demand
Tier 2: Solid Performers
- Gyms and fitness centers, health drinks, electrolyte beverages, protein water
- Shopping malls (near food courts or entrances), foot traffic surges on weekends
- Hotels, guests pay a convenience premium, especially near elevators and lobbies
- K–12 schools, consistent student demand, though pricing may be regulated
- Government buildings, steady Monday–Friday foot traffic
Tier 3: Supplementary Locations
- Laundromats, long waits create purchase opportunities
- Auto dealerships and repair shops, waiting room captive audience
- Real estate offices, insurance agencies, and smaller but consistent
Location Tip from Experienced Operators
The best locations share one trait: people can’t easily leave to get a drink elsewhere. A factory floor worker on a 10-minute break isn’t walking to 7-Eleven. A hospital patient’s family member isn’t leaving to find a coffee shop. Prioritize ‘trapped audience’ situations, and your per-machine income will consistently outperform the industry average.
How Cashless Payments Impact Monthly Vending Machine Income
This one change, adding a card reader and mobile pay capability to your machine, may be the highest-ROI investment you make after securing a good location.
Industry data consistently shows:
- Cashless transactions increase average vending machine sales by 25–50%
- The average transaction value is higher when customers pay by card (they spend more)
- Cash-only machines lose sales every time a customer doesn't have the correct change
- Younger demographics (18–35) are the heaviest vending users, and they rarely carry cash
Yes, credit card processing fees run 2–4% per transaction. But if enabling cashless payments grows your monthly revenue by 30%, you’re netting significantly more even after processing fees. On a machine doing $500/month, that’s an extra $150/month in gross revenue for a $15 fee increase.
Modern smart vending machines from vendors like Agape Vending Machines come out of the box cashless-ready, with no retrofitting required.
ROI Analysis: When Does a Drink Vending Machine Pay for Itself?
A new beverage vending machine costs between $3,000 and $5,000. A quality used machine runs $1,500–$3,000. Here’s how the payback period works across different profit scenarios:
Machine Cost | Monthly Net Profit | Estimated Breakeven Timeline |
$1,800 (used machine) | $150/month | ~12 months |
$1,800 (used machine) | $300/month | ~6 months |
$4,000 (new machine) | $200/month | ~20 months |
$4,000 (new machine) | $400/month | ~10 months |
$4,000 (new machine) | $700/month | ~6 months |
After breakeven, the machine’s profit is essentially pure cash flow, minus ongoing operating costs. A $4,000 machine making $350/month nets you $4,200 in year two, $4,200 in year three, and so on. Over five years, that’s one machine generating $17,000–$21,000 in cumulative net profit from an initial $4,000 investment.
That’s a 400–500% return over five years, significantly better than most savings accounts or index funds.
Scaling from One Machine to a Profitable Vending Route
One machine is a side income experiment. Ten machines are a serious business. Here’s how the economics change as you scale:
Number of Machines | Estimated Monthly Net Profit | Estimated Time Required / Month |
1 machine | $150–$400 | 4–8 hours |
5 machines | $750–$2,000 | 12–20 hours |
10 machines | $1,500–$4,000 | 20–35 hours |
20 machines | $3,000–$8,000 | 35–55 hours |
50+ machines | $7,500–$20,000+ | Part-time staff often required |
The efficiency gains are real: you’re already making a service run, adding three more machines to the same route doesn’t triple your fuel cost. Buying inventory in bulk reduces your per-unit product cost. One insurance policy often covers multiple machines.
Most full-time vending operators run 20–50 machine routes and generate $40,000–$80,000 in annual net profit. The top 10% of U.S. vending operators earn over $1 million annually.
Common Mistakes That Kill Vending Machine Profit
These are the errors that separate operators who grow their business from those who sell their machine on Craigslist after six months.
Mistake #1: Choosing Location Based on Convenience, Not Traffic
Your cousin’s small auto shop might be a nice favor, but if only 15 people walk through daily, the machine will consistently underperform. Always evaluate foot traffic counts, hours of operation, and captive audience potential before signing a placement agreement.
Mistake #2: Not Accounting for Sales Tax
Many states require vending operators to collect and remit sales tax on beverage sales. An average state sales tax rate of ~8% affects your effective profit margin on every transaction. Factor it into your pricing from day one.
Mistake #3: Overstocking Slow-Moving Products
If energy drinks sit in the machine for three weeks while cola sells out daily, you have a cash flow problem. Use sales data, even a simple notebook log, to track what moves and what doesn’t. Cut the slow movers and double down on your best sellers.
Mistake #4: Ignoring Machine Maintenance
A jammed coin mechanism or a temperature sensor issue can take your machine out of service for days. Regular cleaning, monthly inspections, and prompt repairs protect your monthly income. Budget $300–$500 per year for maintenance, even if nothing seems wrong.
Mistake #5: Underpricing Products
New operators often underprice to attract buyers. This is a mistake. Customers in a hospital or office building are not price-shopping; they’re thirsty and want convenience. Research comparable prices at nearby convenience stores and price at or slightly above that level.
Expert Tips to Maximize Monthly Drink Vending Machine Income
Tip 1: Negotiate Commission as a Percentage, Not a Flat Rate
If your machine underperforms at a location, a percentage-based commission (say, 10% of sales) means your cost scales down with your revenue. A flat $100/month fee hurts you in a bad month.
Tip 2: Stock the Top Shelf with Premium, High-Margin Items
Eye-level placement drives impulse purchases. Put your highest-margin beverages, premium water brands, sports drinks, and energy drinks at eye level. These items typically offer better margins than standard Coke or Pepsi and increase your average transaction value.
Tip 3: Add Your Machine Number to Every Service Visit
Track your service visits by machine ID. This lets you identify which machines consume the most of your time and compare them to their profit contribution. A machine that takes two hours per visit but nets only $80/month is costing you more than it makes.
Tip 4: Use Wholesale Beverage Suppliers Strategically
Don’t buy exclusively from one supplier. Costco, Restaurant Depot, and regional beverage distributors all offer different pricing on different products. Building relationships with wholesale beverage suppliers can reduce your product cost by 15–25%, which flows directly to your bottom line.
Tip 5: Revisit Underperforming Locations After 90 Days
Give every location a genuine 90-day trial before moving the machine. Traffic patterns shift. Seasonal changes affect drink sales. But after 90 days of consistent underperformance, don’t hesitate to relocate. The machine is your asset; it works hardest in the right environment.
FAQ: Drink Vending Machine Profit and Income
A typical soda vending machine earns between $10 and $50 per day in gross revenue. In high-traffic locations, daily sales can exceed $100. Net profit per day, after costs, usually runs $5–$25 depending on location and expenses.
It's more accurately described as semi-passive income. You don't need to be present all day, but you will spend time restocking, servicing, and managing the machine, typically 2–6 hours per month per machine. With good systems in place, it can run largely on autopilot.
Gross profit margins on beverages typically run 40–60% before operating expenses. Net profit margins after all costs typically range from 20–35% of gross revenue. Premium beverages like flavored water and energy drinks can push margins even higher.
Most operators break even in 6–18 months depending on machine cost and monthly net profit. A $3,000 machine netting $300/month pays for itself in about 10 months.
The highest-performing locations share one quality: a captive audience with limited alternatives. Hospitals, manufacturing plants, office buildings, airports, and universities consistently perform best.
Ready to Start Your Drink Vending Machine Business?
The numbers are real, the business model is proven, and the barrier to entry is lower than almost any other income stream. Whether you’re buying your first machine or building out a ten-machine route, the fundamentals stay the same: the right location, the right products, and managed costs.
At Agape Vending Machines, we help entrepreneurs like you get set up with the right equipment, locations, and guidance, from your first machine to your first profitable route.
Explore our beverage vending machine inventory, or get in touch with our team to talk through your goals. There’s no pressure, just honest advice from people who know this business.